Sadiq Shamji
projects
2025
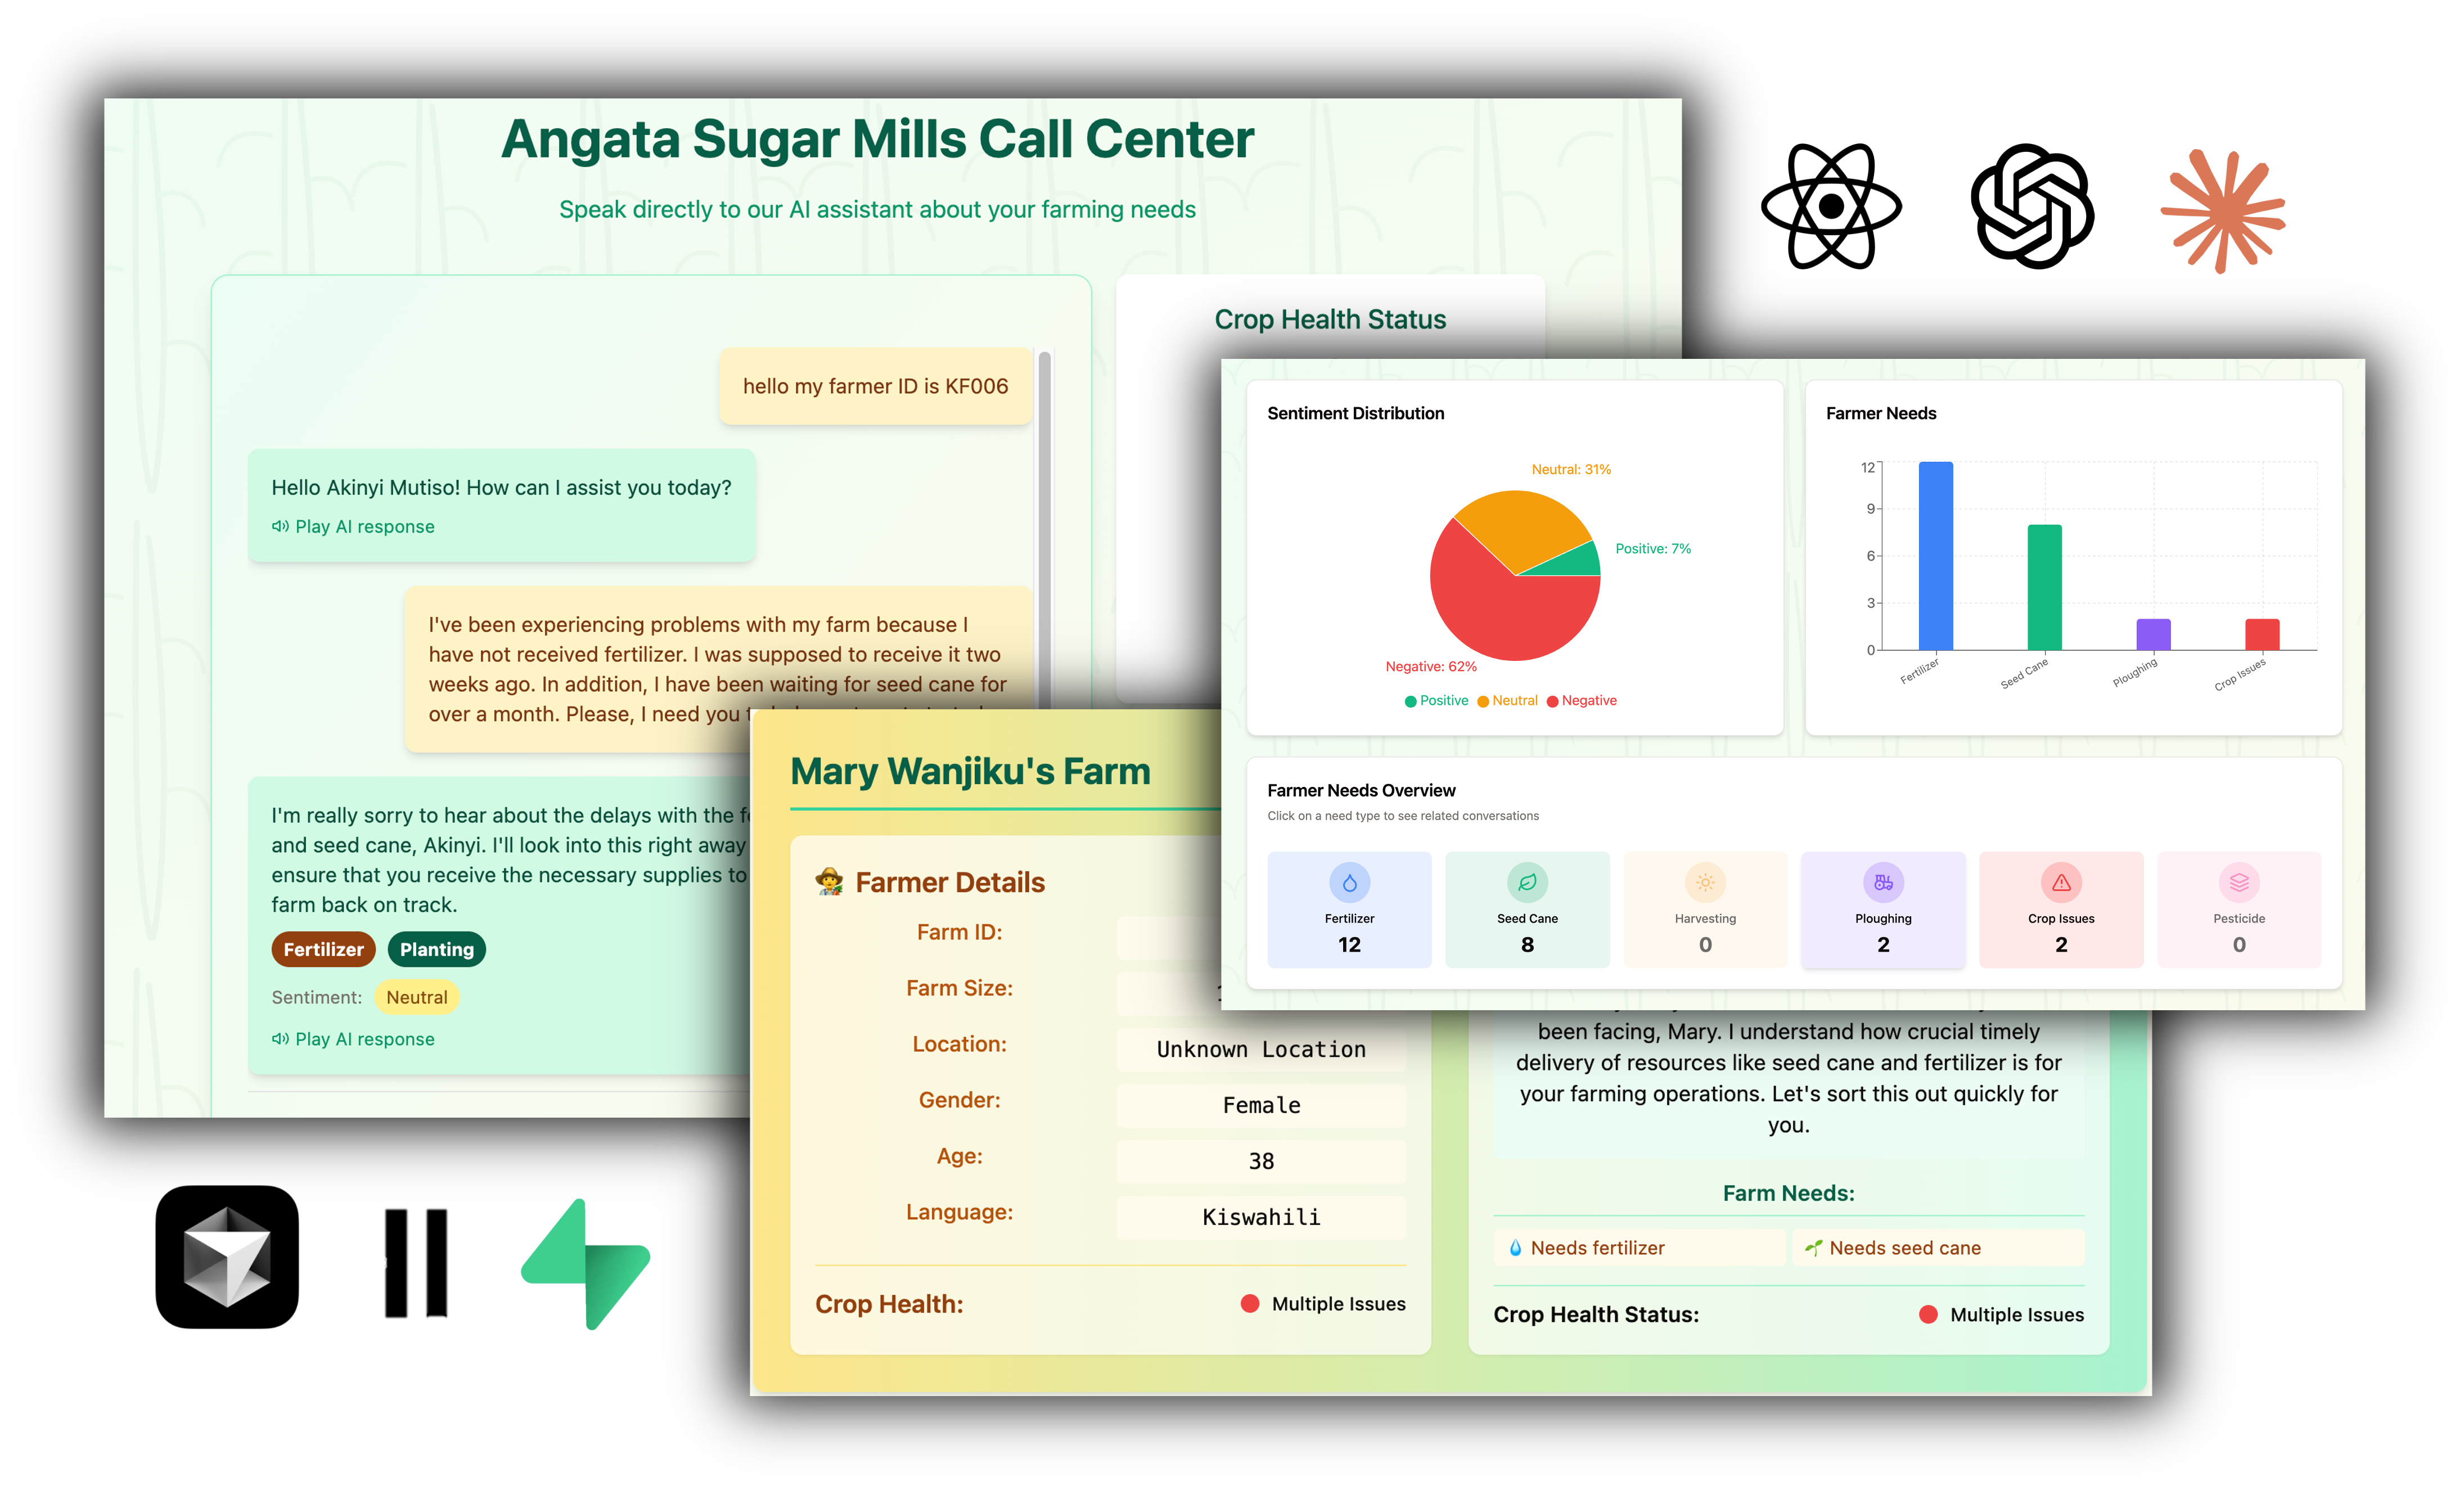
AI Powered Call Center for Farmers
Built a React App to interpret farmer needs, provide solutions, log issues into a CRM, aggregate sentiment and common issues and enable issue tracking. Currently working on multilingual capabilities and GSM Integration (Deployment Pending)


2025
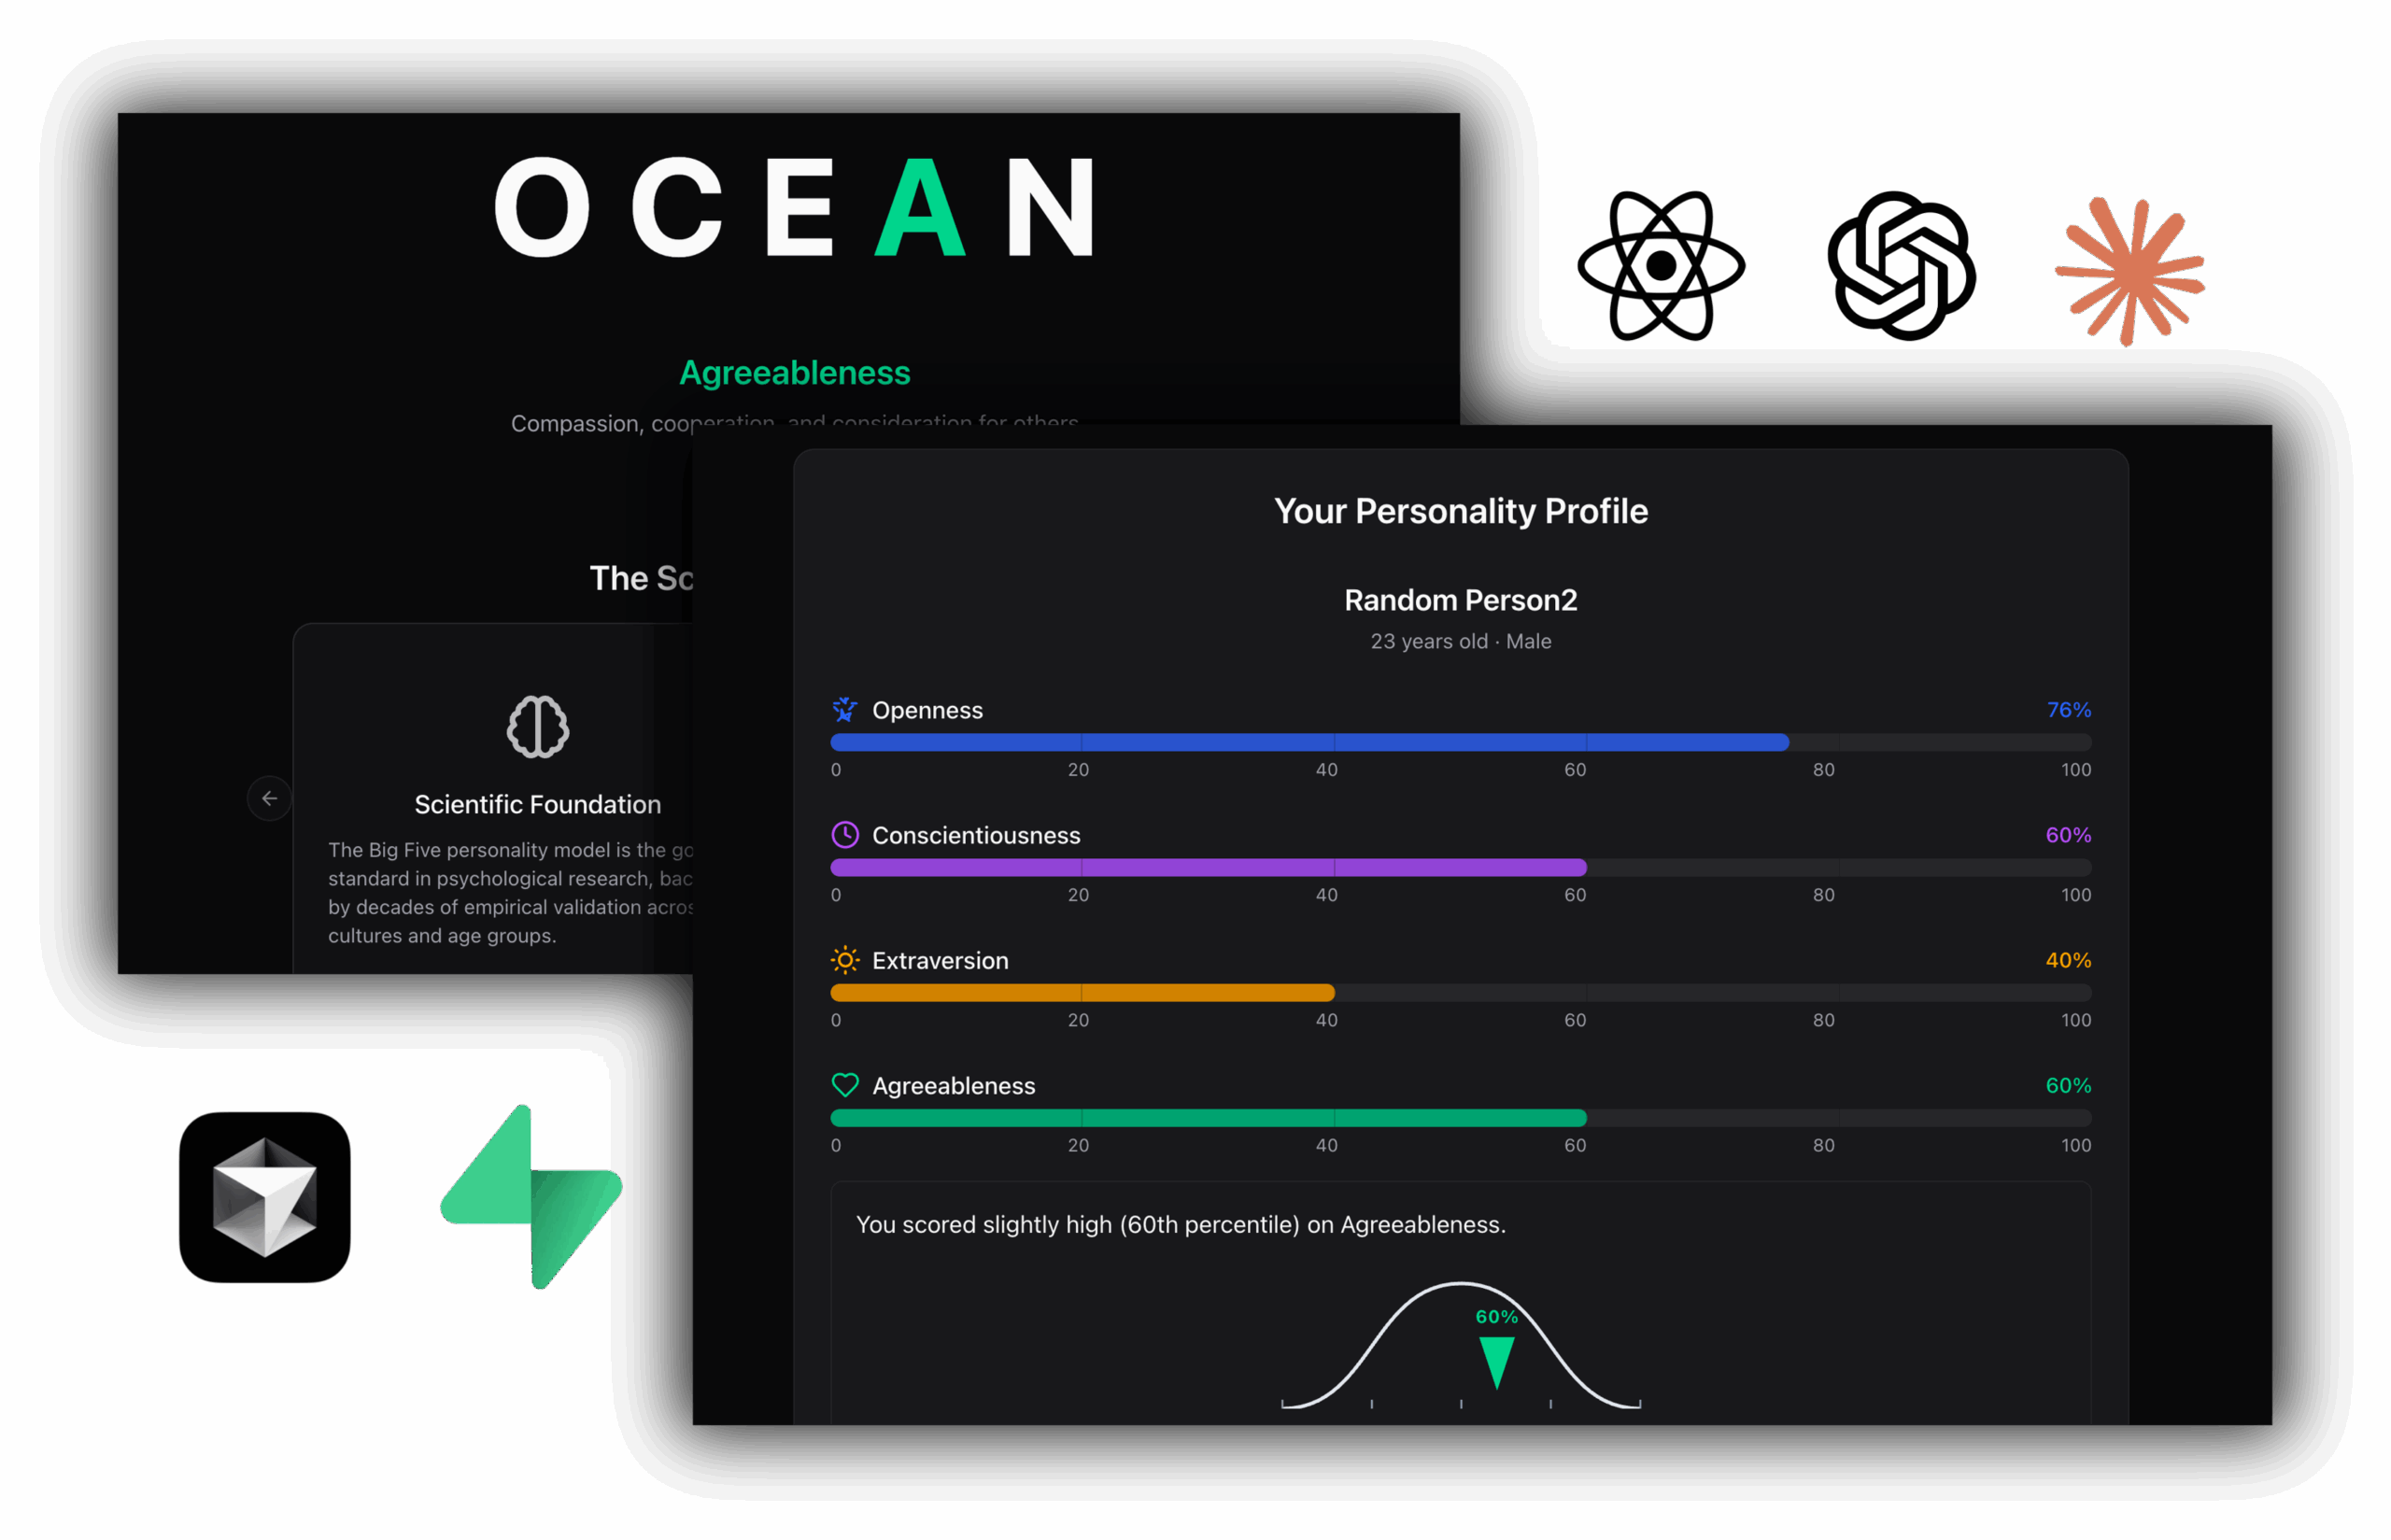
AI React App: Five-Factor Model
Built a react app with next.js and using Cursor AI + Claude 3.7 to allow people to dive into big 5 personality traits and use them as a basis for self-understanding and career mapping. (Deployment Pending)
2022
Association for Mineral Exploration
Using survey data from multiple mining companies, created a dashboard to track safety conditions over time. The pages, crafted through consultation, show the data by geography, time, company type and more. It also enables the user to slice the data by relevant indicators and perform root-cause analysis.

2021
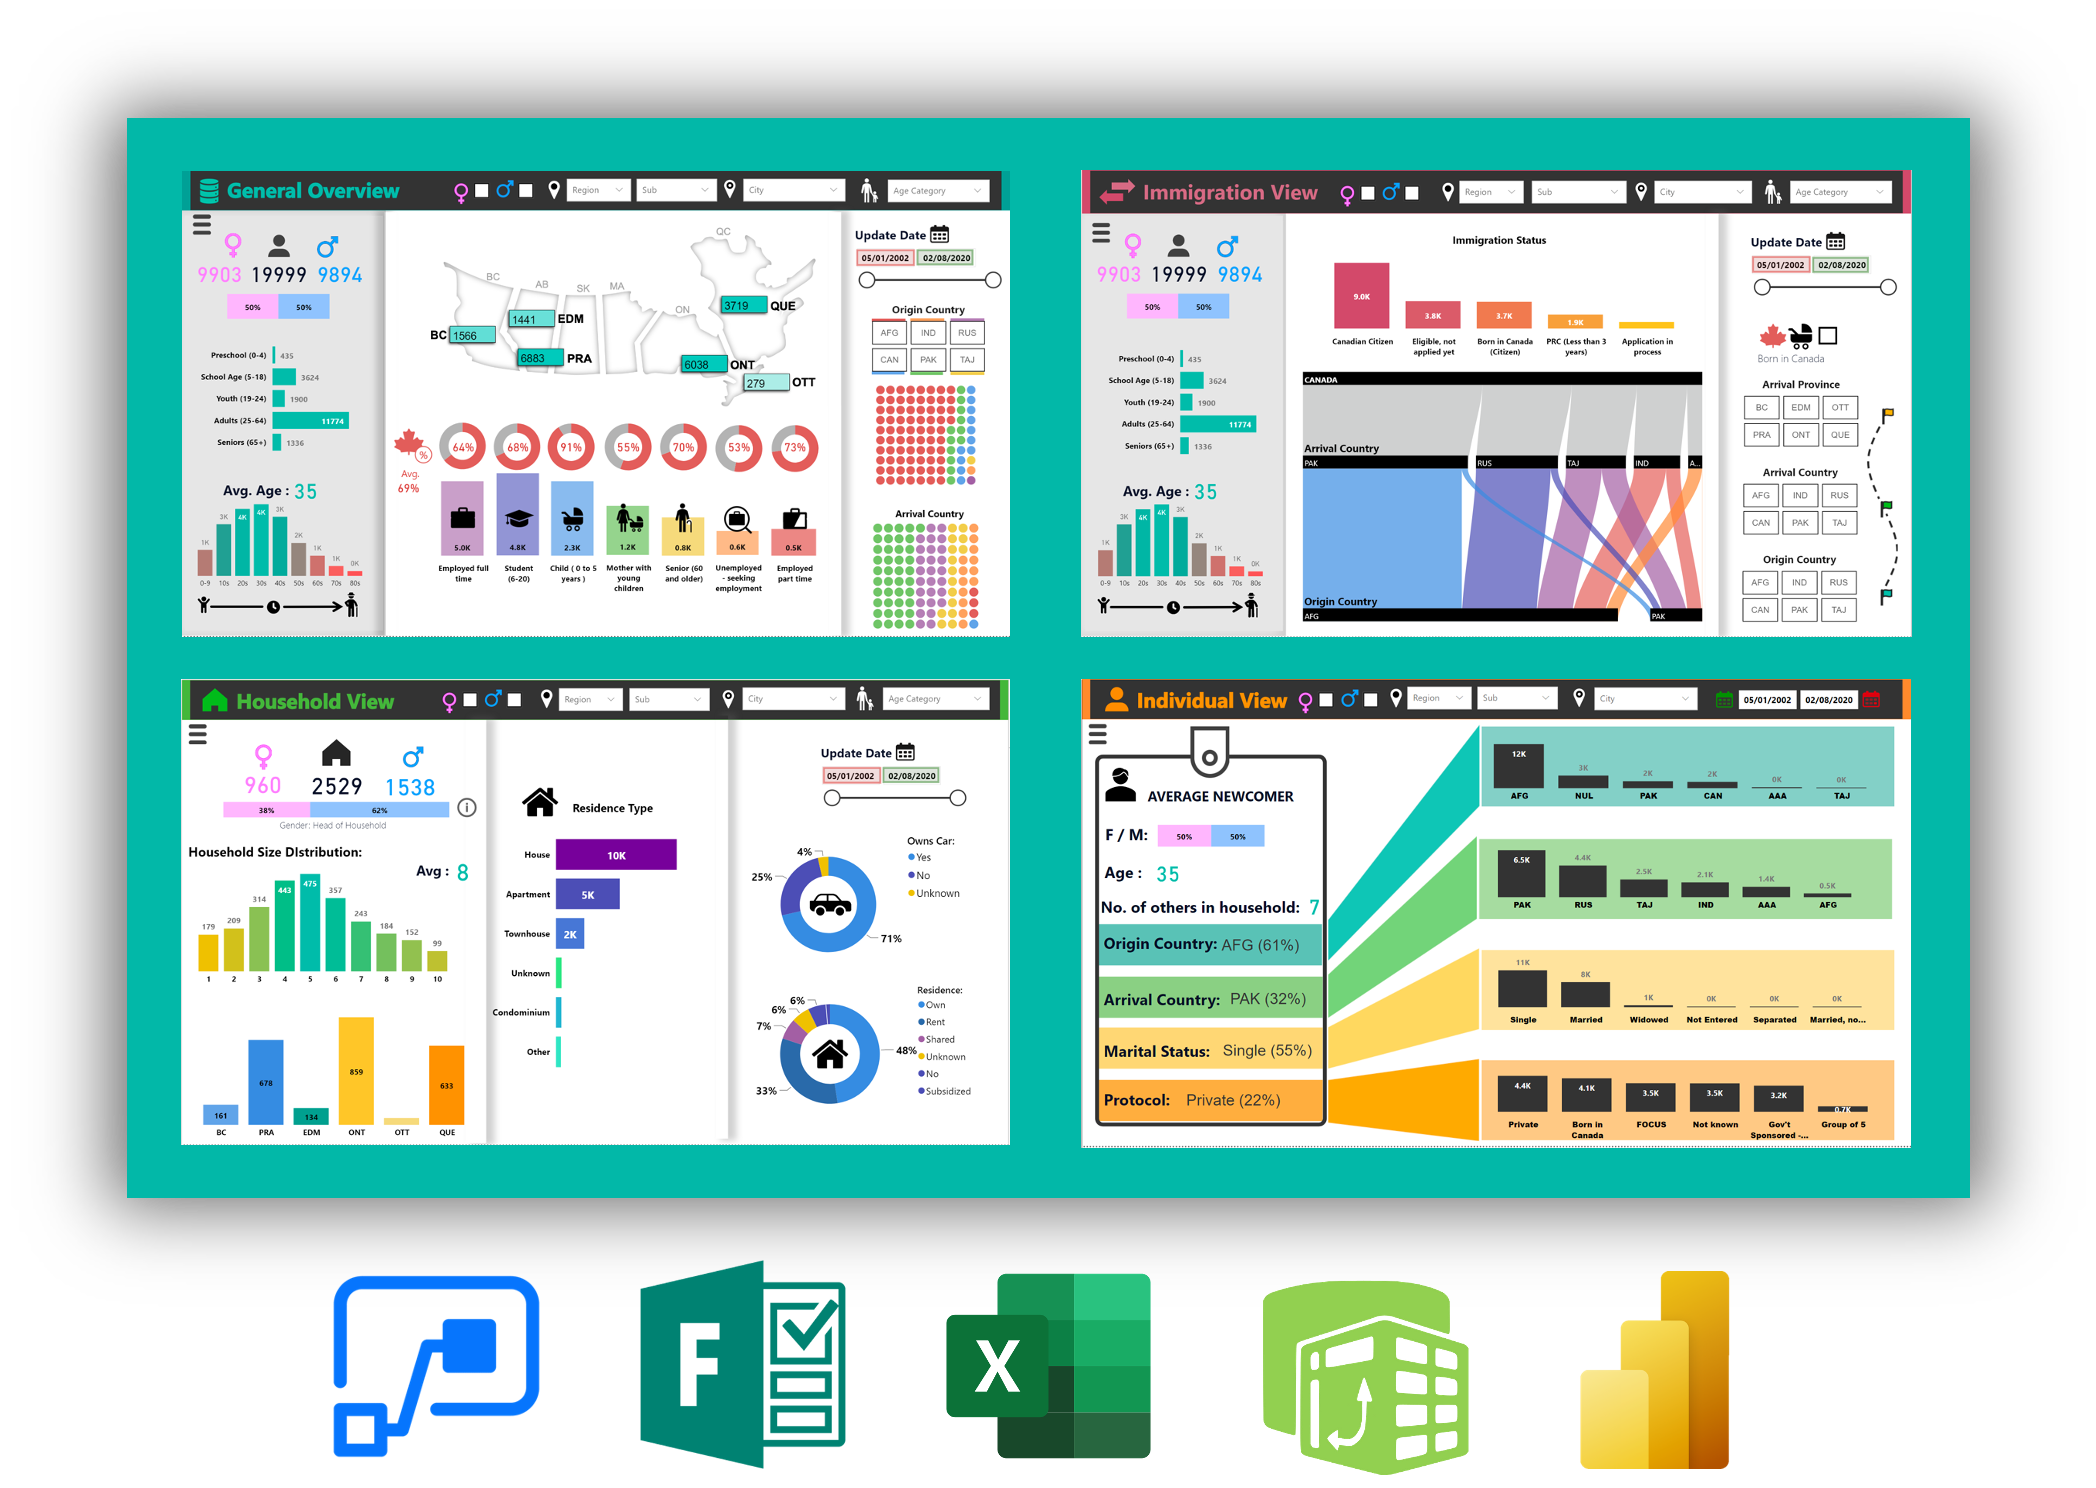
FOCUS Canada - Refugee Settlement
Created an end-to-end pipeline for data (on newcomers into Canada) to be mined, wrangled and flow into interactive dashboards. These dashboards analyze historical patterns and current profiles of newcomers, and help data-driven policymaking around support provision.
2020
Aga Khan Development Network (AKDN)
Noticing a lack of quality data for the AKDN, I decided to create my own solution. This involved scraping, reverse-geocoding, data wrangling and finally dashboard creation for 8 separate institutions. I currently consult with the AKDN head office (on a voluntary basis) regarding data matters and mapping.
2021
COVID-19 x Google Mobility
This passion project combines the latest COVID-19 Data with Google Mobility statistics released in the wake of the pandemic. The goal is to see how movement patterns have changed and the correlation with movement an incidence rates, observable regionally and by country.
2021
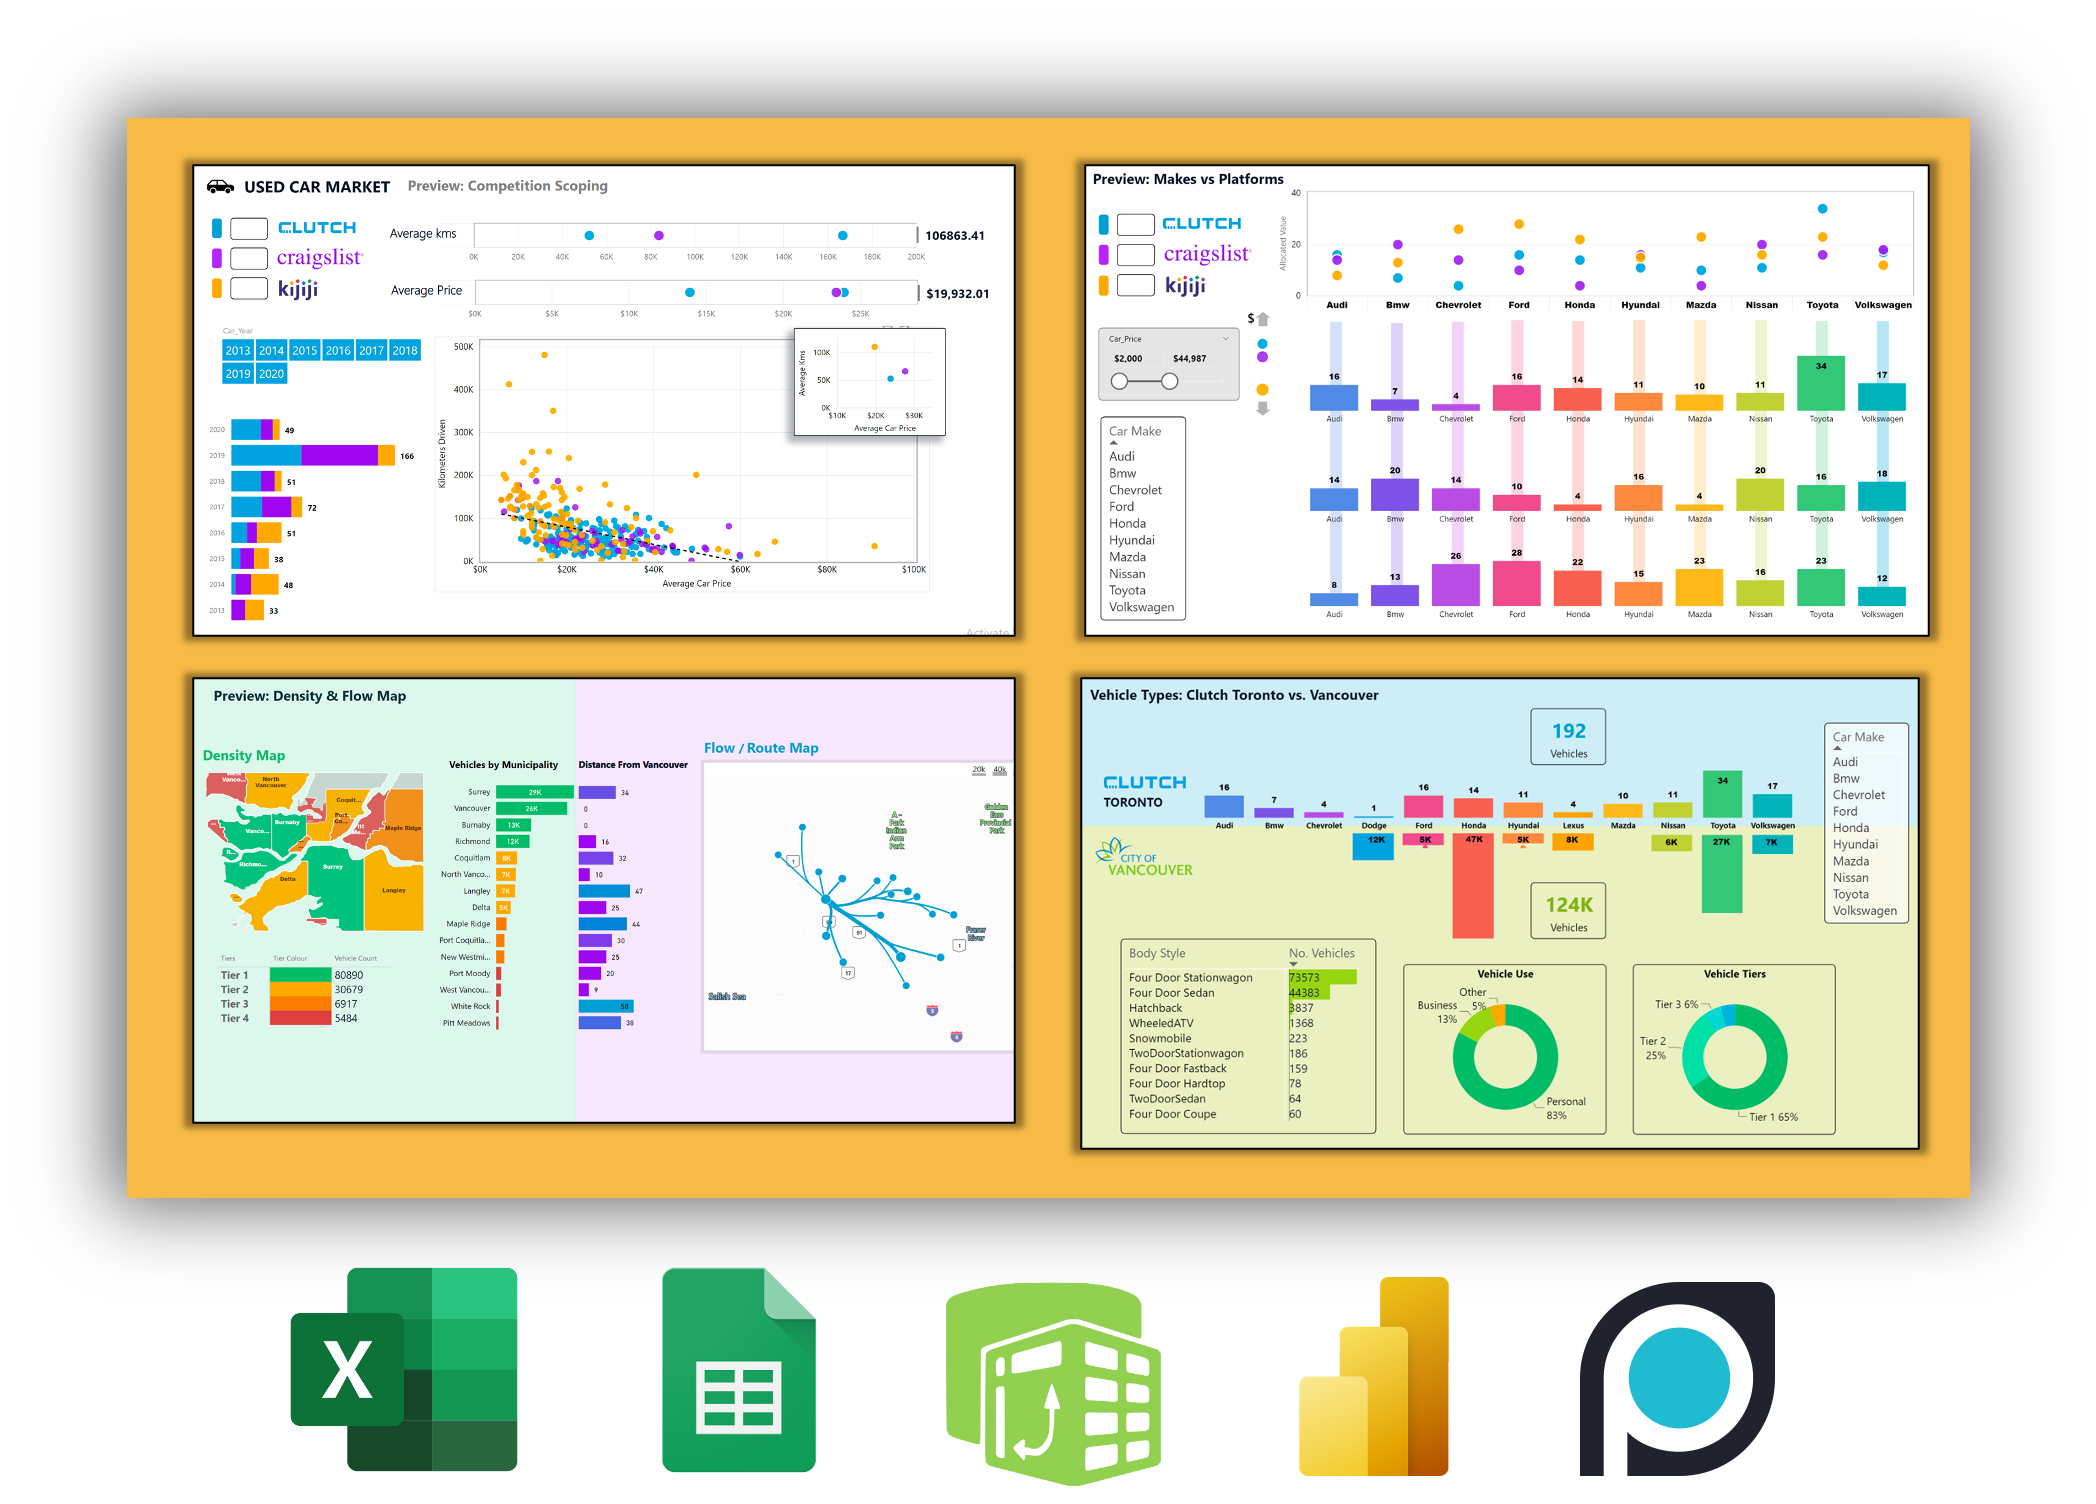
Automotive Analysis : Used Cars
Using Publicly available data from Clutch, Craigslist, Kijiji as well as ICBC, conducted some market analysis of the used car market in Toronto vs Vancouver. The dashboard extrapolates pricing and odometer trends from 600 Data points. It also compares model types with 20,000+ data points from ICBC (breakdown by body type and vehicle use), as well as the geographical distribution of licensed vehicles in Metro Vancouver.

Let’s Ideate!
Contact me about cool stuff pls! (Especially cool AI Stuff)
